
Every advertiser asks the same question once a campaign is live: what did I actually get? On Vugo, the answer is in your campaign report, and it's built on one rule. What's counted is counted from the car, what's modeled is labeled as a model, and you only pay for what was confirmed.
Here's what Vugo tracks today, format by format.
In-vehicle screens: counted play by play
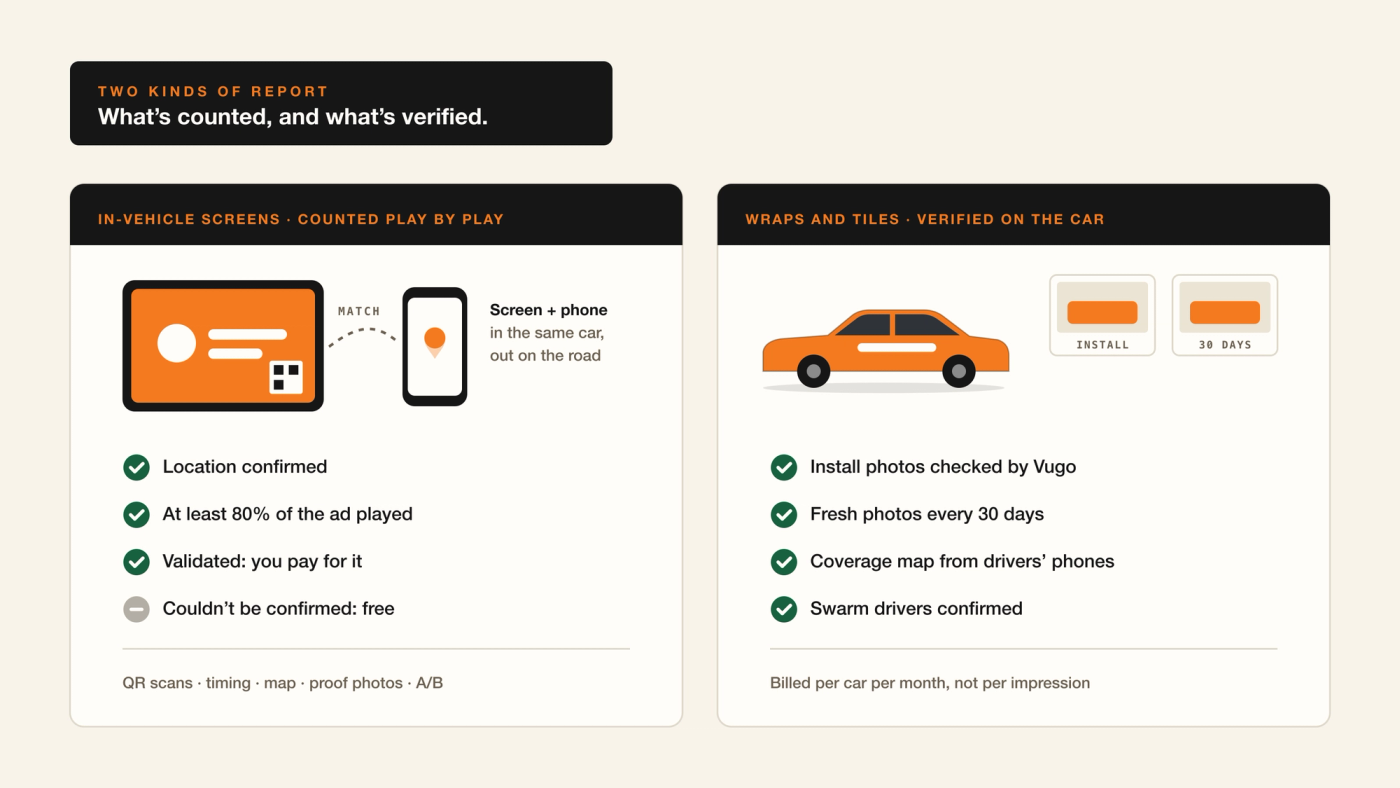
Every play on a screen is checked before it counts. A play is a validated impression when Vugo can confirm it ran in a working car out on the road: for a driver's screen, the screen's location matches the driver's phone, and for a fleet's screen, the screen reports its own location. A play also has to run at least 80% of the ad. Plays that can't be confirmed aren't billed. Validated Impressions explains the rule in full.
Your screen campaign report shows:
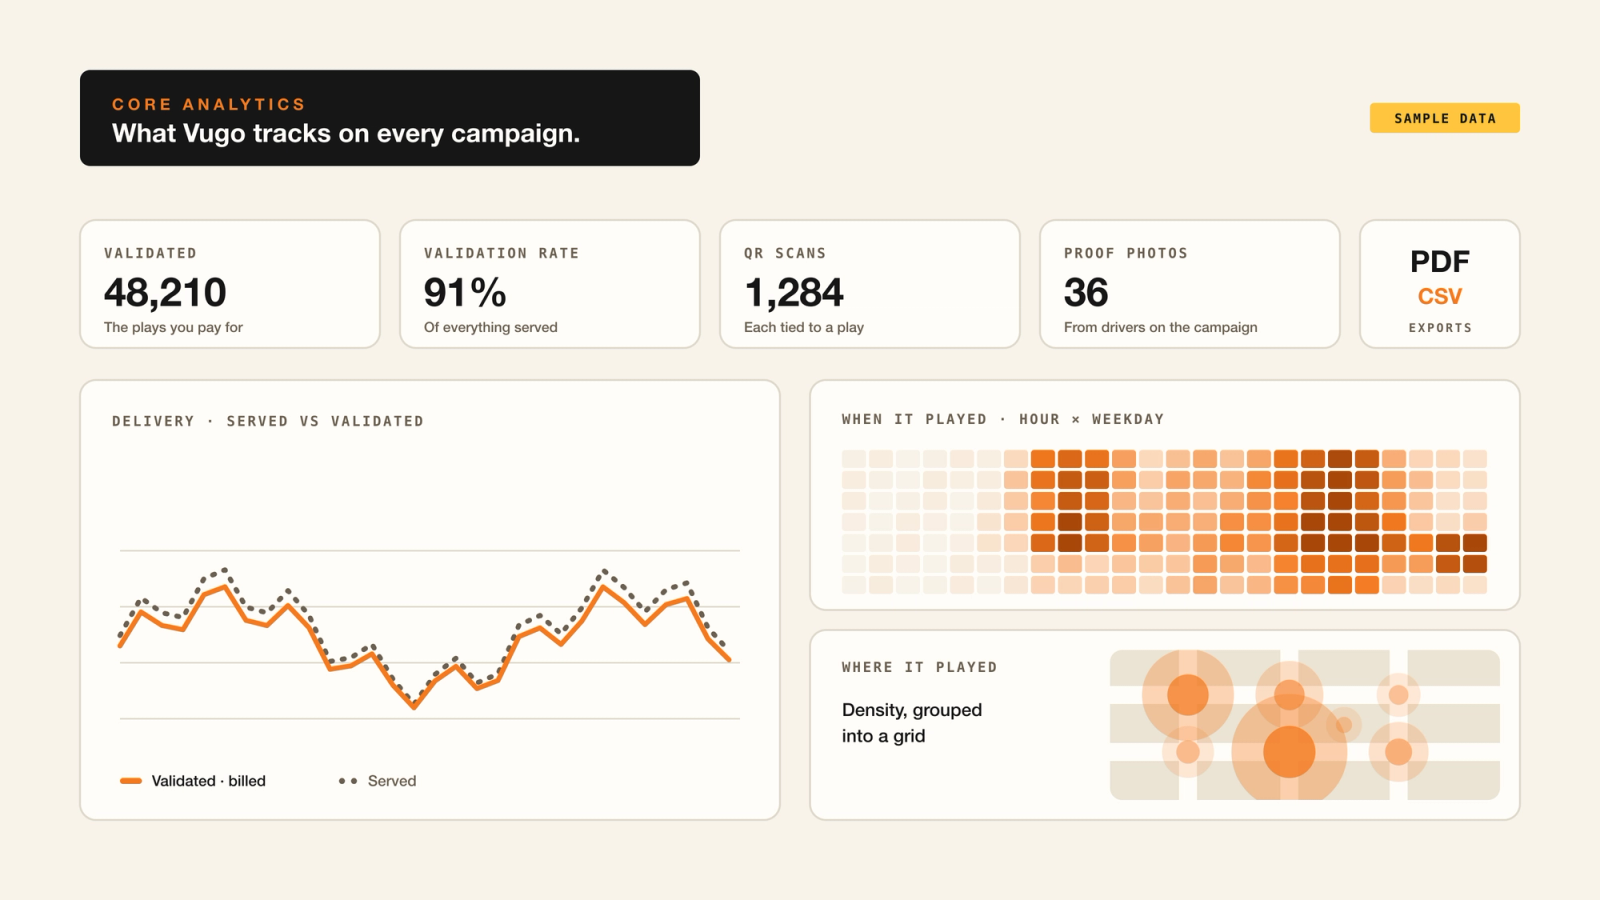
- Validated impressions. The plays you pay for, with a daily average for the days the campaign delivered.
- Validation rate. Validated plays as a share of everything served, so you can see how much ran free.
- Spend and CPM. What you've spent against your budget, at your CPM, plus any bonus impressions delivered at no charge.
- Delivery over time. Served and validated plays side by side, by day, week or month.
- Where it played. A density map of every play with a GPS position across your market, validated or not, grouped into a grid. Validation decides what's billed, not where an ad played. Vugo never gives advertisers driver names or contact details.
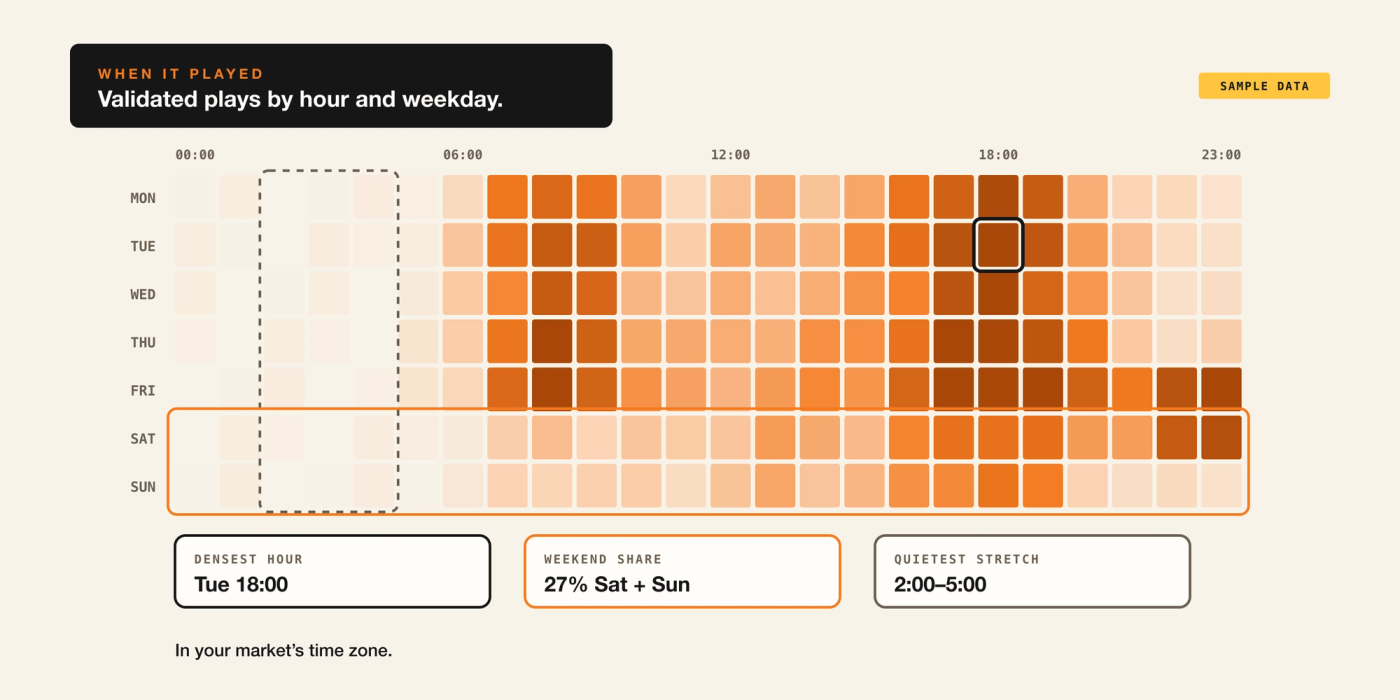
- When it played. A grid of validated plays by hour and day of the week, in your market's time zone, with the densest hour, the weekend share and the quietest three-hour stretch called out.
- QR scans. Every scan is tied to the play that showed it. Add UTM tags and your own analytics credits each visit to Vugo. QR Codes and UTM Tracking.
- Reach by place. The share of validated plays in the last 30 days that ran where TripIntent® read a matching place, such as airports, dining or nightlife. It's a read on context, not a targeting setting, and sensitive places are never used. How TripIntent works.
- Near your location. If your campaign has a location set, delivery near it is sorted into cars that passed nearby and cars that were headed there. Where a fleet's dispatch feed is connected, rides that dropped off inside the area show too. See Who Came Close.
- Proof of play. Ask the drivers on your campaign for a photo of your ad on the screen, get an email when one arrives, and download them all in one pack.
- Version results. See plays for each version of your creative. With an A/B test, the cars on your campaign are split evenly across two to four versions, and the report shows each version's plays, validation rate and QR scans side by side. It's a straight comparison, not a statistical test, and when you've seen enough you can put the winner on every car. Introducing Vugo Planning covers testing.
Wraps and Tiles: verified on the car
Wraps and Tiles are bought per car per month, not per impression, so their report is about the cars: that each one carries your brand, and where they've been.
- Cars installed. How many cars carry your wrap or Tiles, against how many were ordered.
- Install proof. Install photos come from the shop, the driver or the fleet, and Vugo checks them before a car counts as installed.
- Proof photos. Install and in-car photos, each dated and location-tagged, with fresh photos requested from drivers every 30 days while the campaign runs.
- Coverage map. Where your wrapped cars have driven, as a density map built from the drivers' phones, refreshed through the day.
- Swarms. For each window you schedule, the drivers you asked for and the drivers confirmed, with the swarm zone highlighted on the coverage map. How Swarms Work.
- Vehicle-days and modeled impressions. Vehicle-days count each car's days on the road since its install. Any impression figure on a wrap is a model, labeled as one, and never what you're billed on.
Tiles have the same report. Swarms are for wraps only.
Take it with you
- PDF report. The campaign's delivery, map, timing, QR scans and proof photos in one document. When an agency runs the account, the PDF carries the agency's logo.
- CSV data. Daily served and validated plays, validation rate and spend for the period you pick, ready for a spreadsheet, plus delivery by place context on the Analytics page.
- Photo pack. Every proof-of-play photo in one download.
- Media plan. The plan you built in Vugo Planning, as a PDF and a flight schedule.
How current it is
Plays are checked as they come in, usually within a minute. If a phone's location arrives late, Vugo waits up to 10 minutes for it before deciding. Your overview updates on its own while a campaign is live.
What Vugo doesn't track
Being clear about the limits is part of the report.
- Who's in the car. Vugo screens capture no images, video or audio of the cabin, and they don't count or identify riders.
- Measured audience. Vugo doesn't measure who saw an ad. Where a page shows an audience or wrap impression figure, it's a model, and it says so.
- Drivers' identities. Advertisers see delivery, not the people behind it.
For transit and fleet media, Vugo Measure is coming soon. It verifies delivery from operators' own vehicle data and is a separate product. See Vugo Measure.
See it for yourself
The quickest way to see the report is to run a campaign. Explore Vugo Platform or talk to Vugo about your next one.