
Updated October 2026 with American Career College's results after 10 months on Vugo, and what Vugo's formats cost per thousand impressions compared with other media.
Every advertiser who looks at car wraps or rideshare screens asks the same two questions. Does anyone actually notice an ad on a car? And if they do, does it change anything?
For years there was one industry study to point to. Now there are three, plus results from campaigns that have run on Vugo. This post puts all of it in one place: what each study found, how it was done, what it doesn't tell you, and what it means when you plan a campaign.
The short version
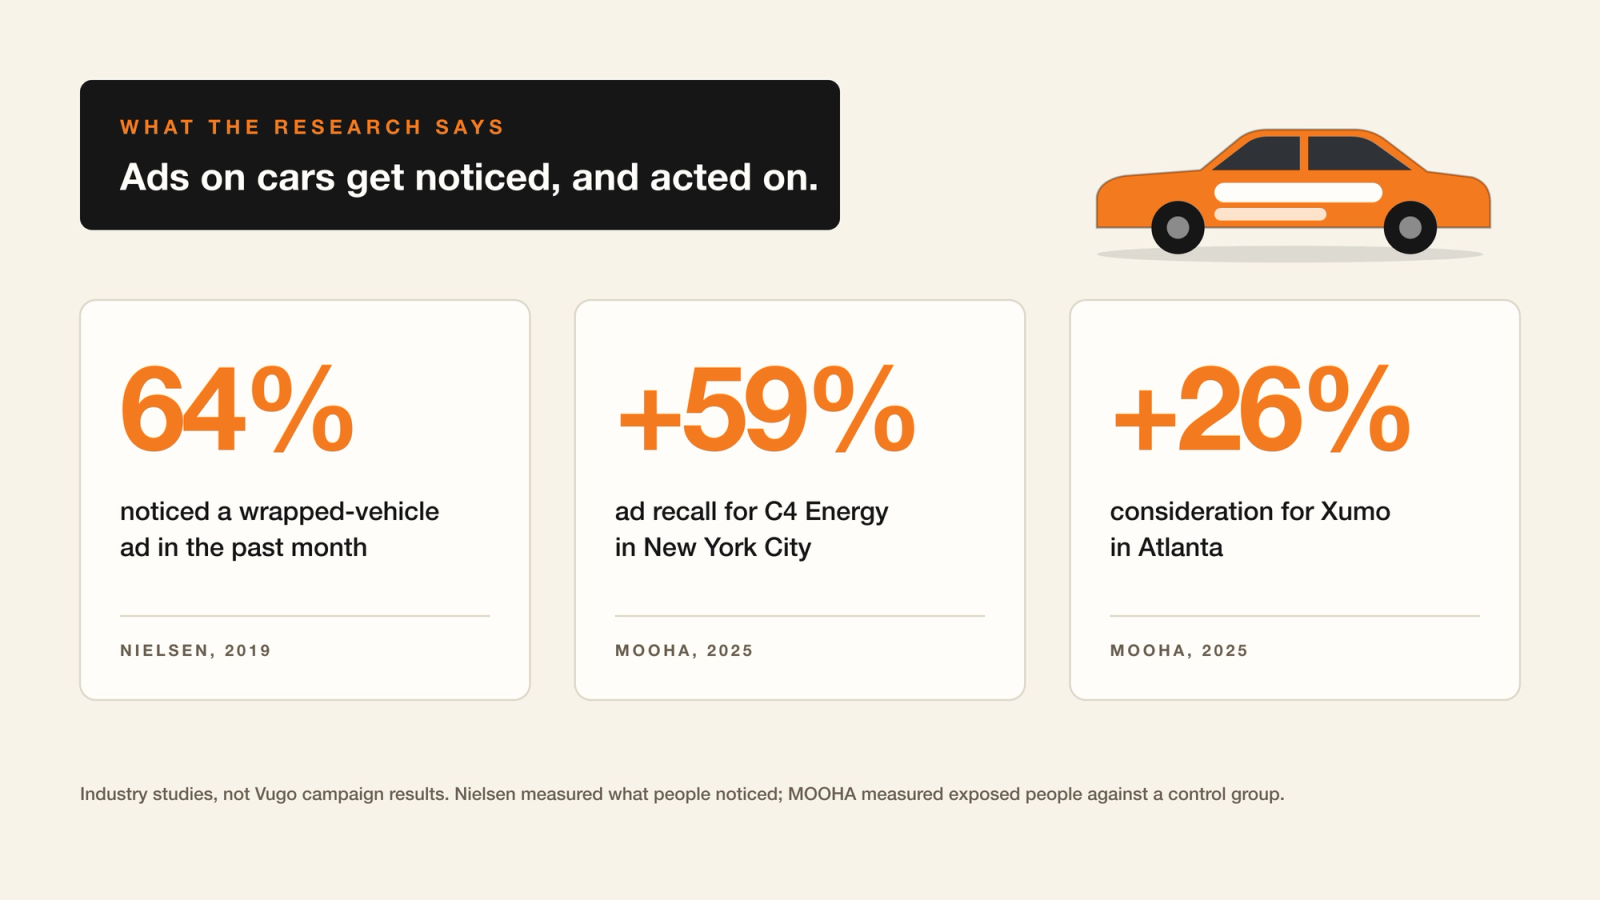
- People notice. In Nielsen's 2019 national survey, 64% of U.S. residents age 16 and older had noticed a wrapped-vehicle ad in the past month. Of 15 out-of-home formats, only roadside billboards were noticed by more people.
- People remember. In MOOHA's 2025 study of C4 Energy's campaign in New York City, ad recall rose 59%, four times the category benchmark. In its study of Xumo's campaign in Atlanta, recall rose 24%.
- People consider and buy. Consideration rose 26% for Xumo. C4 saw a 31% higher likelihood of purchase and an 11.6% in-store sales lift.
- People act. People exposed to Xumo's campaign were 61% more likely to visit its website. In Nielsen's survey, 42% of smartphone owners had searched for an advertiser after seeing an out-of-home ad.
- It pays off at scale. On Vugo, American Career College's Standard Wraps delivered more than 100 million impressions in their first 10 months, at a CPM under $1.
The rest of this post is the detail behind each line, starting with the oldest study.
1. People notice ads on cars
The Nielsen Out-of-Home Advertising Study, 2019 edition, is the broadest look at how Americans travel and what they notice along the way. Nielsen surveyed 999 U.S. residents age 16 and older between March 27 and April 5, 2019: people who had walked around town, been in a car or other vehicle, or ridden a bus, taxi, train or subway in the past month. Respondents saw sample images of 15 out-of-home formats and said when they had last noticed each one.
Until MOOHA's brand studies in 2025, it was the industry's main study of ads on vehicles, and its headline finding for wraps is striking.
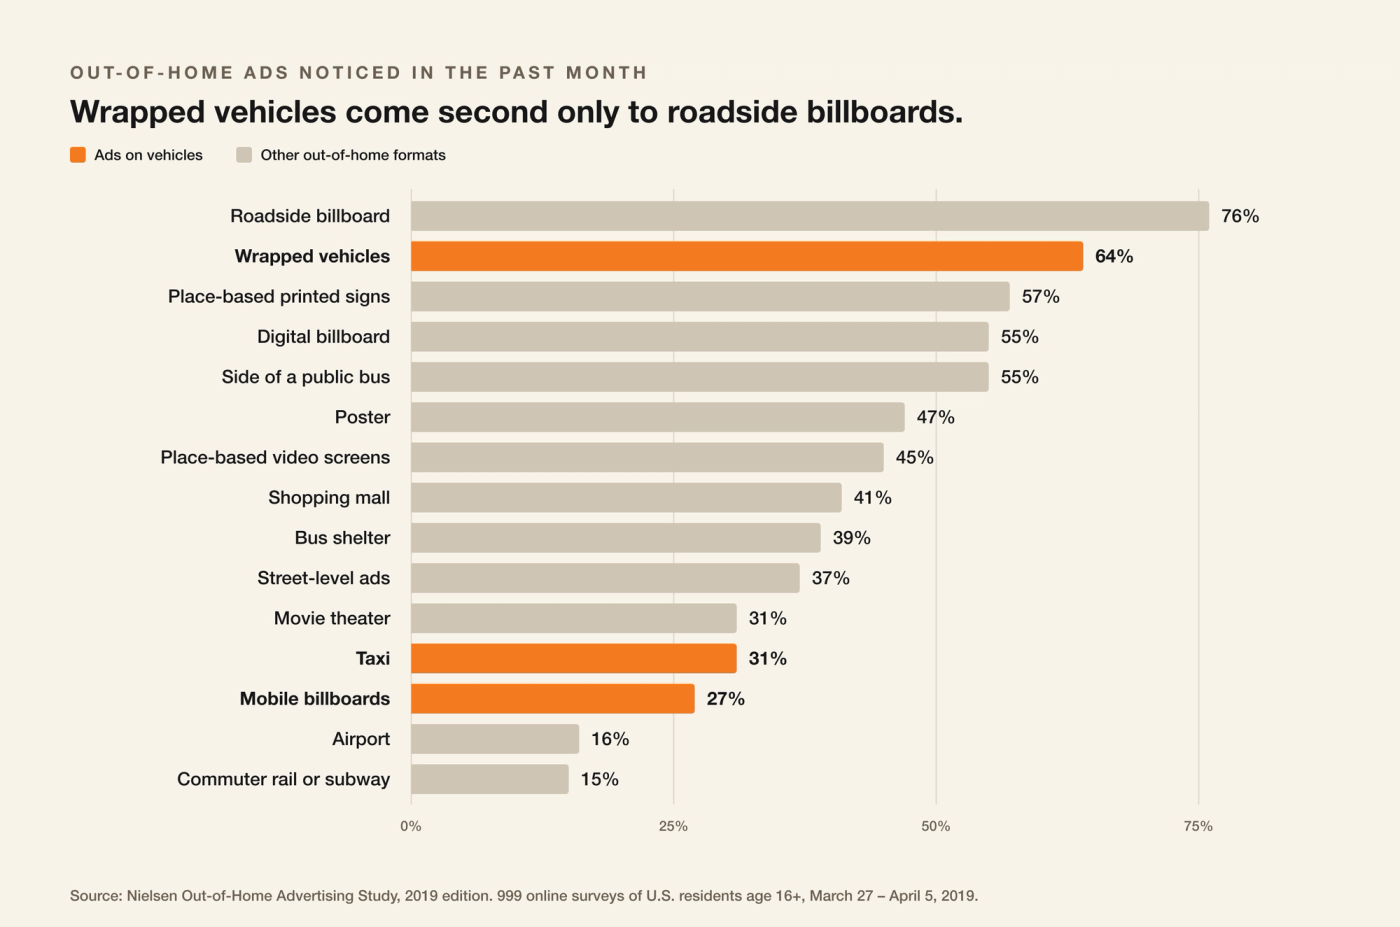
- 64% had noticed a wrapped-vehicle ad in the past month, and 44% in the past week.
- That put wrapped vehicles second of 15 formats, behind roadside billboards (76%) and ahead of digital billboards and the sides of buses (55% each), posters (47%) and bus shelters (39%).
- 31% had noticed ads on taxis in the past month. Among people who ride buses, taxis or trains, that rose to 48%.
Why would a car compete with a billboard? Part of the answer is time. The average traveler in Nielsen's survey spent more than 25 hours a week in a vehicle and covered 159 miles. Heavy travelers, those driving more than 150 miles a week, spent about 36 hours. That is a full day every week spent beside, behind and across from other cars, and a wrapped car isn't fixed to one corner. It moves with the traffic, through the neighborhoods and past the venues where people actually spend their time.
One caution: Nielsen asked when people last noticed each kind of ad, not whether they remembered a particular brand. These are noticing figures, not recall, and they cover wrap and taxi advertising from every advertiser and vendor in 2019. They tell you the format gets seen. The next studies tell you what seeing it does.
2. Noticing turns into action
Nielsen also asked people who had noticed out-of-home ads what they had done afterward in the past year. The answers are self-reported and cover out-of-home ads in general, not only ads on vehicles, but they show where attention goes next:
- 42% of smartphone owners had searched for an advertiser on their phone after seeing an out-of-home ad, and 66% had taken some action on their phone.
- 33% had accessed a coupon or discount code, and 21% had downloaded or used an app shown in an ad.
- 20% had scanned a QR code, tapped an NFC tag or sent a text in response to one.
- 25% had visited a restaurant they saw advertised, 19% a store or other business, and 14% an event.
- 26% had watched a TV program and 14% had tuned to a radio station they saw advertised.
The most useful finding for local advertisers is about directions. Nearly four in ten out-of-home viewers (39%) had noticed an ad that gave directions to a specific business. One in five out-of-home viewers had gone to a business right away, within 30 minutes, because of its ad, and 74% of them bought something.
The lesson for creative is simple: give people a next step. A short web address, a QR code or an address they can find turns a glance into a visit.
3. Moving media lifts brand measures
Noticing is the first step. In 2025 the Moving Out of Home Association (MOOHA), a division of the Digital Place-based Advertising Association, began publishing brand studies that measure what comes after it, using control groups. It has published two.
C4 Energy in New York City
For eight weeks, C4 Energy, with Nutrabolt's agency ODN, ran a moving out-of-home campaign built around Madison Square Garden. On New York Knicks game days, vehicles carrying C4 swarmed the blocks around the arena; the rest of the week, the same fleet covered Manhattan and the surrounding boroughs. The goal was to lift sales in local stores.
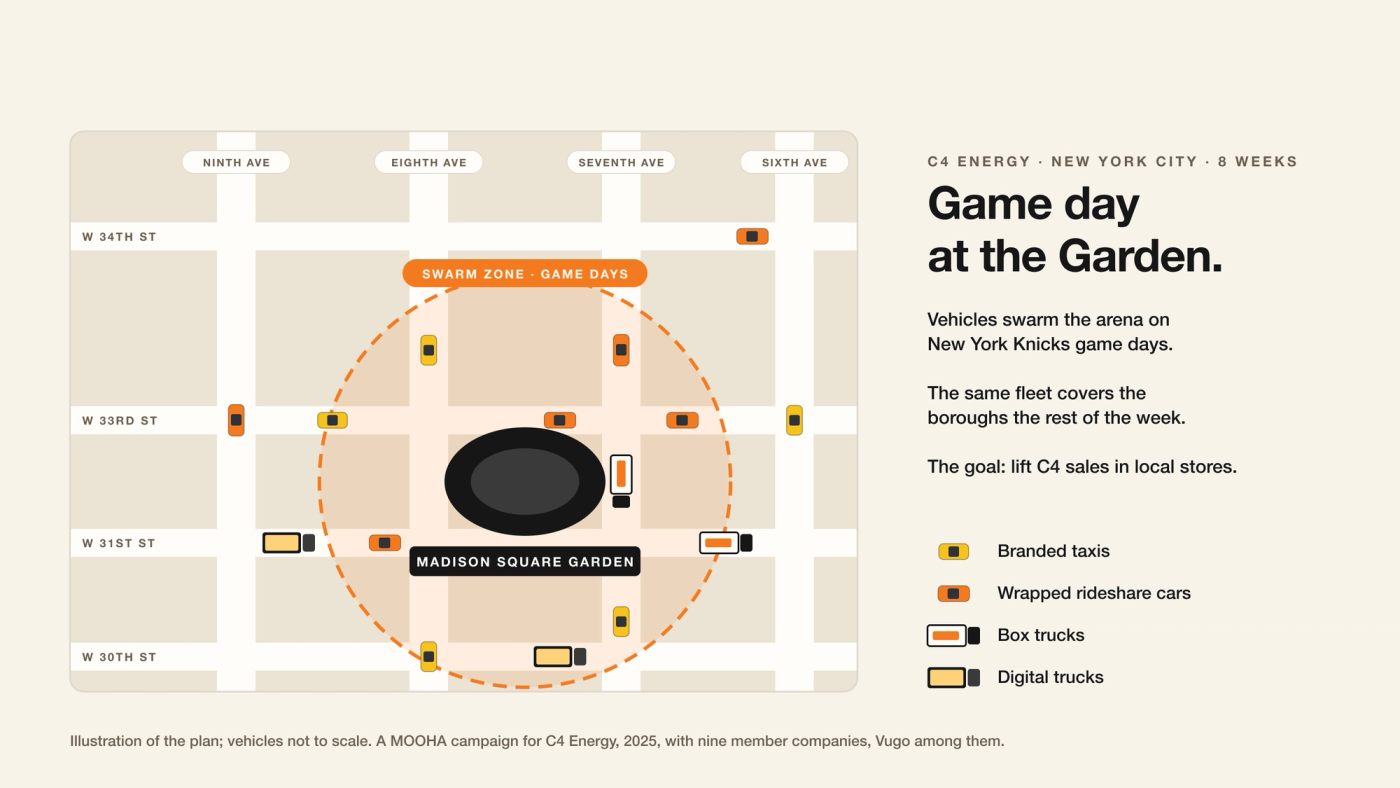
The fleet was box trucks, digital trucks, wrapped rideshare cars and more than 100 branded taxis, from nine MOOHA member companies; Vugo took part as a member of MOOHA. Reveal Mobile, StreetMetrics and Pathformance measured the campaign. According to MOOHA:
- 52 million impressions among adults 18+
- +59% ad recall, four times the category benchmark
- 31% higher likelihood of purchase, 6.5 times the benchmark
- 11.6% in-store sales lift
These figures are for the whole campaign, across every partner's vehicles, and MOOHA didn't publish the sample sizes behind them. What they show is a campaign that moved each step a brand cares about, from remembering the ads to buying at the shelf. Read the C4 case study.
Xumo in Atlanta
Xumo, Comcast and Charter's streaming joint venture, promoted its streaming TVs, the Xumo Stream Box and its free Xumo Play service across the Atlanta DMA from April 1 to May 27, 2025, with digital and moving out-of-home media from several MOOHA member companies. It wanted both awareness and direct engagement: people who would remember the brand and people who would go and look it up. Vugo wasn't on this campaign. We include it because its method is published in full and its findings apply to the category, whoever sells the media.
Reveal Mobile matched ad exposure to historical mobile location data, then surveyed 1,318 mobile users in apps: 621 who had been near the campaign's media and a control group of 697 who hadn't.
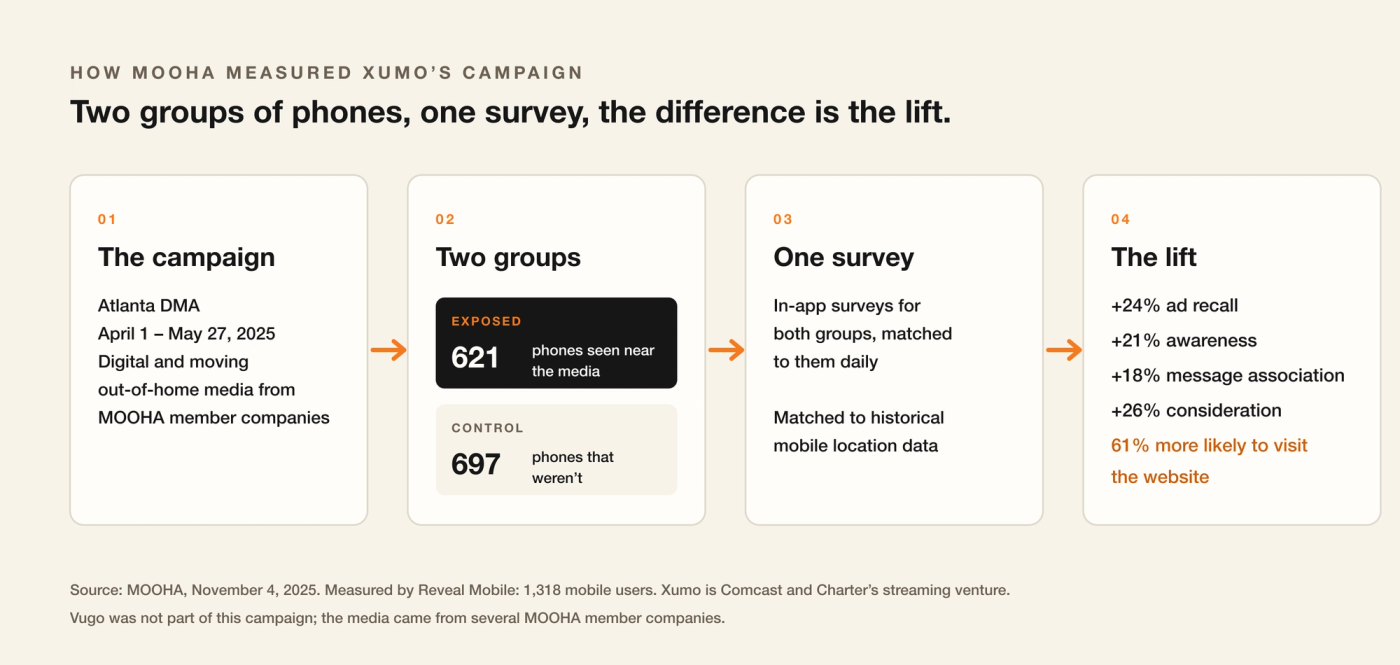
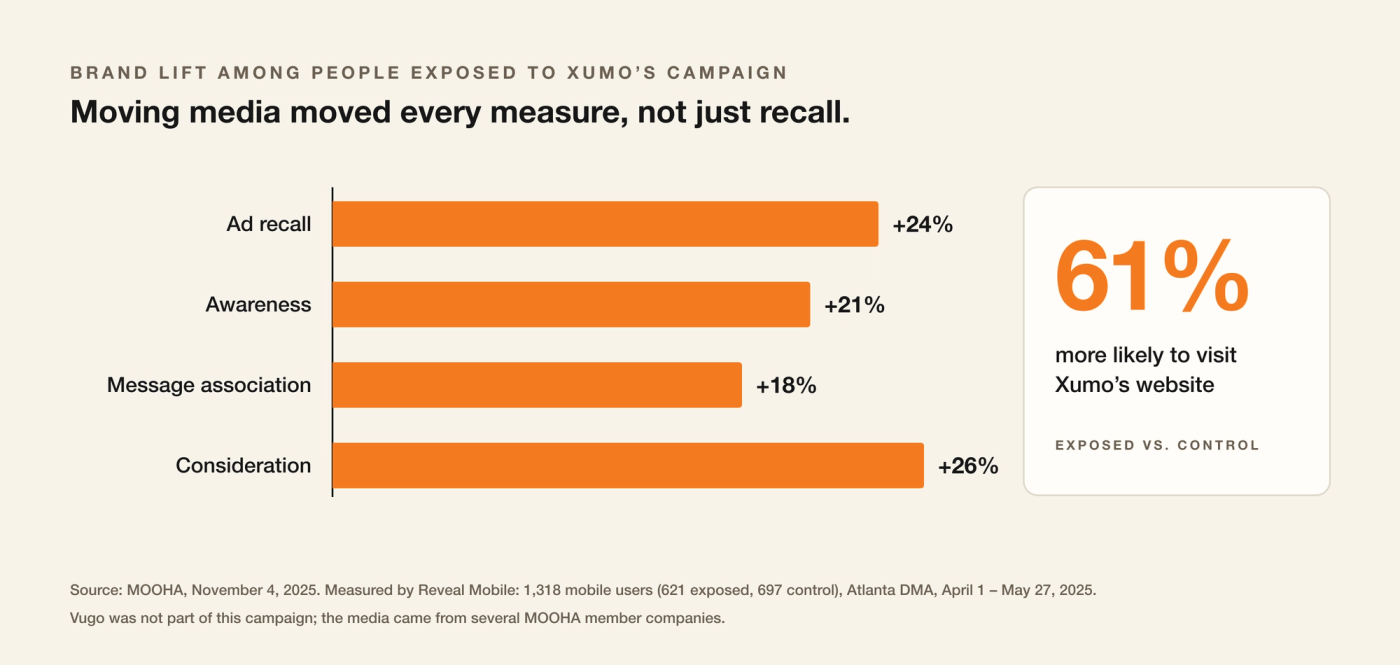
Every measure moved: +24% ad recall, +21% awareness, +18% message association and +26% consideration. And people who saw the campaign were 61% more likely to visit Xumo's website than people who didn't.
That last number matters most to performance marketers. Moving media isn't only a brand play: in a controlled study, it sent people to the advertiser's site.
4. What it looks like on Vugo campaigns
Industry studies describe the category. Here is what campaigns on Vugo have delivered, as published in our case studies with each advertiser's approval.
- American Career College, Los Angeles. Standard Wraps, covering both sides of the car and the rear window, planned and bought in Vugo Platform. More than 100 million impressions in the first 10 months at a CPM under $1, which keeps falling with two months left to run. Read the case study.
- Dash, Miami. Rooftop displays across the Miami market for November and December 2021, through Art Basel. The plan called for 7.5 million impressions; the campaign delivered 10,140,243, 35% more, for an effective CPM of about $5.92 against $8 planned. Read the case study.
- Bitcoin 2022, Miami. Wraps, digital rooftop displays and in-vehicle screens with QR codes to the ticket page, a swarm of wrapped cars around the convention center on Miami Beach, and programmatic mobile retargeting of people who had visited the ticket page. The conference and its music festival sold out. Read the case study.
- Dick Clark Productions, nationwide. In-vehicle screen campaigns for the American Music Awards, the Academy of Country Music Awards, the Billboard Music Awards and the YouTube Streamy Awards. Dick Clark Productions has renewed five times, with millions of impressions delivered across the campaigns. Read the case study.
- Warner Music Group. In-vehicle screen campaigns for new releases, including a posthumous album from Prince, each with a QR code to the release. Hundreds of thousands of impressions, with purchases tracked to the campaign. Read the case study.
The pattern across them matches the research: people notice the media, the media builds familiarity over weeks and months, and a clear next step, a QR code, a ticket page or a store, turns that familiarity into action.
5. Why ads on cars work
Put the studies and the campaigns side by side and a few reasons stand out.
They're seen where people live, work and go out. A billboard is fixed to one spot. A wrapped car goes where the trips go: neighborhoods, business districts, campuses, airports and venues. When a campaign needs to be in one place at one time, a swarm brings the campaign's wrapped cars into a zone you choose, with a radius from a tenth of a mile to ten miles, for a window you schedule.
There's nothing to skip. No ad blocker, no skip button, no scrolling past. The street is one of the few places a brand can still be seen without competing with a feed.
They build frequency over months. Wrap campaigns typically run two to six months, so the same people see your brand again and again on their commute, at lunch and on the way home. That repetition is what moves recall and consideration.
The cost per thousand is low. A wrap carries your brand all day, every day of the flight, which is how American Career College's cost per thousand impressions fell below $1. More on cost below.
Outside and inside work together. Wraps and rooftop displays reach people on the street. In-vehicle screens reach riders inside the car with video and a QR code they can scan from the back seat.
The follow-up can be digital. As part of a campaign, Vugo, your agency or your own team can run a programmatic mobile buy that follows up with people who visited your scan page, in the same areas the cars drive. The Street to Feed play shows how.
6. What it costs
The research says moving media works. The other half of the decision is what it costs to reach a thousand people, and on that measure it holds up well against every major medium.
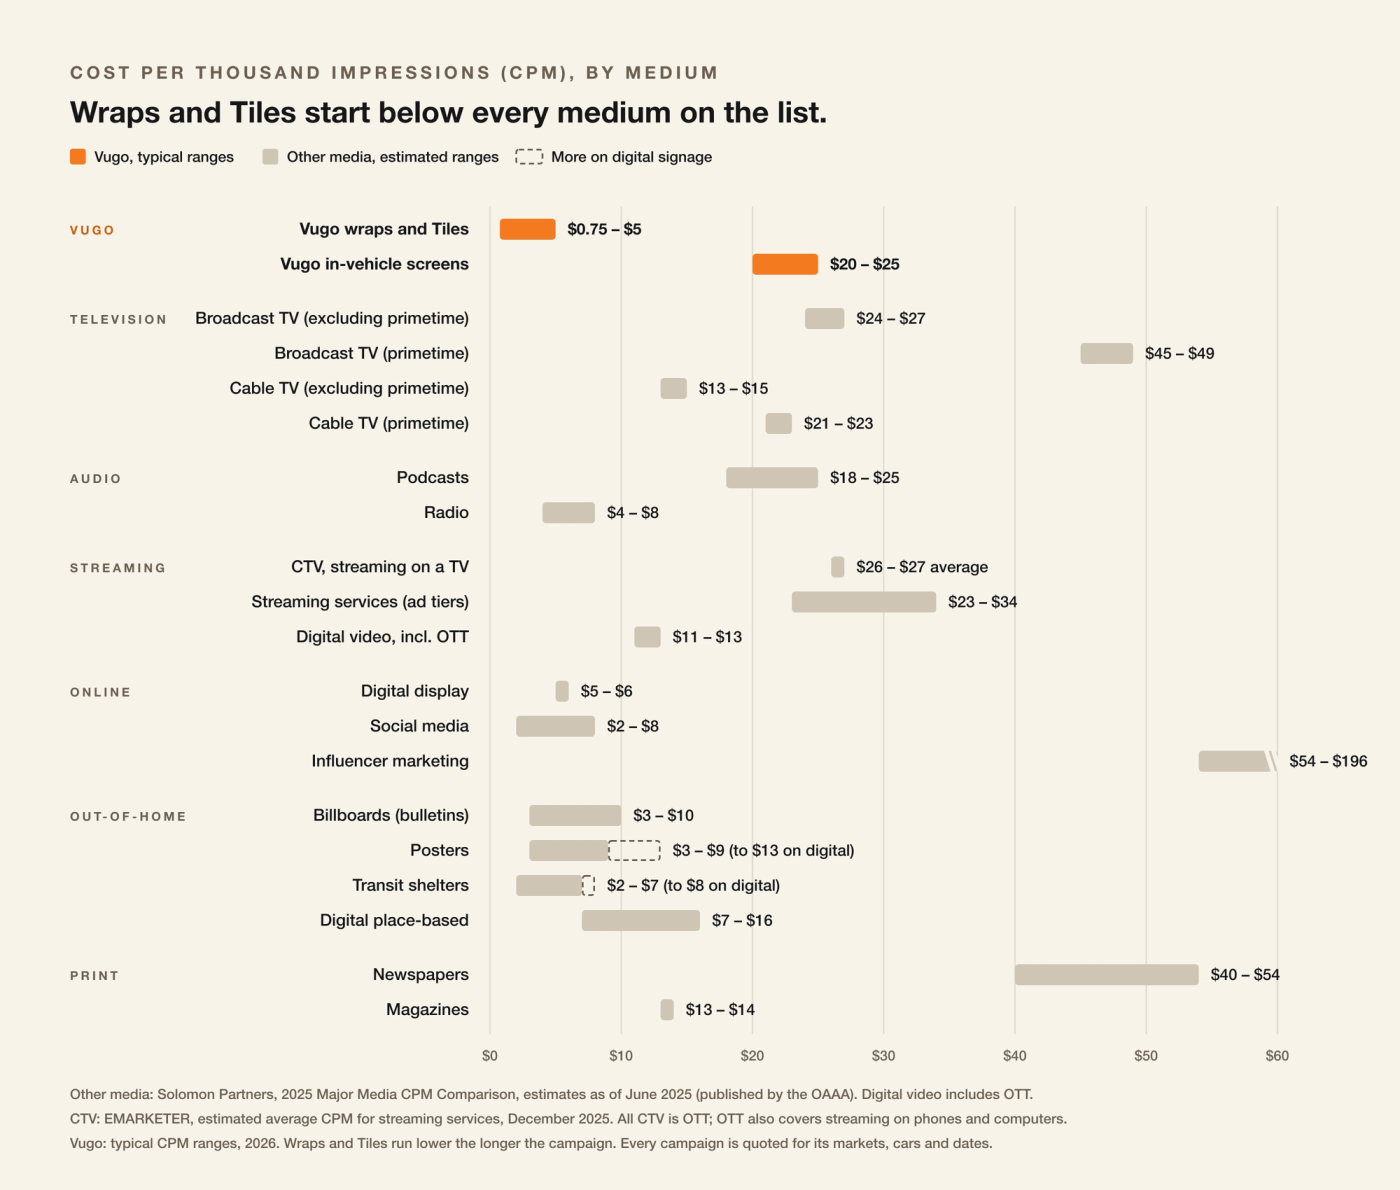
- Wraps and Tiles typically run $0.75 to $5 per thousand impressions, lower the longer the campaign. That starts below every medium in Solomon Partners' comparison of U.S. major media, including social media, display ads, posters and billboards.
- In-vehicle screens typically run $20 to $25, in the range of primetime cable, broadcast TV outside primetime and connected TV (CTV), but interactive and targetable: a QR code to scan, ads aimed by place, time and market, and only confirmed plays billed.
Online CPMs also count impressions no person sees: bots made up 53% of web traffic in 2025, by Thales' count, and about a third of display ads never meet the viewability standard. Solomon's figures are estimates as of June 2025, the CTV average is EMARKETER's from December 2025, and Vugo's are typical ranges, not a price list: every campaign is quoted for its markets, cars and dates. For the full comparison, read Car Wrap and Rideshare Advertising CPM.
7. How to read the numbers
Research is only useful if it's read correctly. Four things to keep in mind, whoever you buy from:
- Noticed isn't recalled. Nielsen's figures measure whether people noticed a format. MOOHA's measure whether people remembered a specific brand, against a control group. Both are useful; they aren't the same thing.
- Know whose results they are. The C4 figures cover nine companies' vehicles together, Vugo's among them. The Xumo study didn't include Vugo. A vendor quoting either one is quoting the category, not its own results, and should say so.
- Self-reported actions are a signal, not a count. Nielsen's action figures are what people said they had done over a year of seeing out-of-home ads. Treat them as direction, and measure your own campaign directly.
- Ask how it was measured. For any figure, ask who measured it, how many people were in the sample, whether there was a control group, and when it ran. Our six questions to ask any vendor cover the rest.
8. Putting the research to work
Here is how we would turn these findings into a plan:
- Pick one goal. Awareness, a launch, store visits or scans. The goal decides the format and how you judge the result.
- Choose the format for the job. Wraps and rooftop displays for presence on the street. In-vehicle screens for action inside the car. Both on the same campaign when you want recognition and a response.
- Give people the next step. A QR code or a short web address, a landing page built for phones, and UTM tags so the visits show up in your own analytics.
- Concentrate where it counts. Plan by metro, a radius around your locations, or a swarm around a venue for the days that matter.
- Run long enough to build familiarity. Wrap campaigns run two months or more, and most run two to six.
- Plan the measurement before launch. If brand lift or sales matter, choose a measurement partner before the campaign starts, so a control group is in place from day one. Vugo's own reports cover what ran, where and when.
All three studies, with their methods and sources, are on our Research page. Vugo campaign results are in our case studies. And when you're ready to plan one of your own, talk to Vugo.