
Every month, tens of millions of Americans get into a car someone else is driving. Who are they? The best answer comes from the federal government's own survey of how Americans travel: the Federal Highway Administration's National Household Travel Survey. Its 2022 data asked everyone 16 and older whether they had used a rideshare service, Uber, Lyft or similar, in the past 30 days.
We ran the numbers on the public data. Here's who rides.
The short version
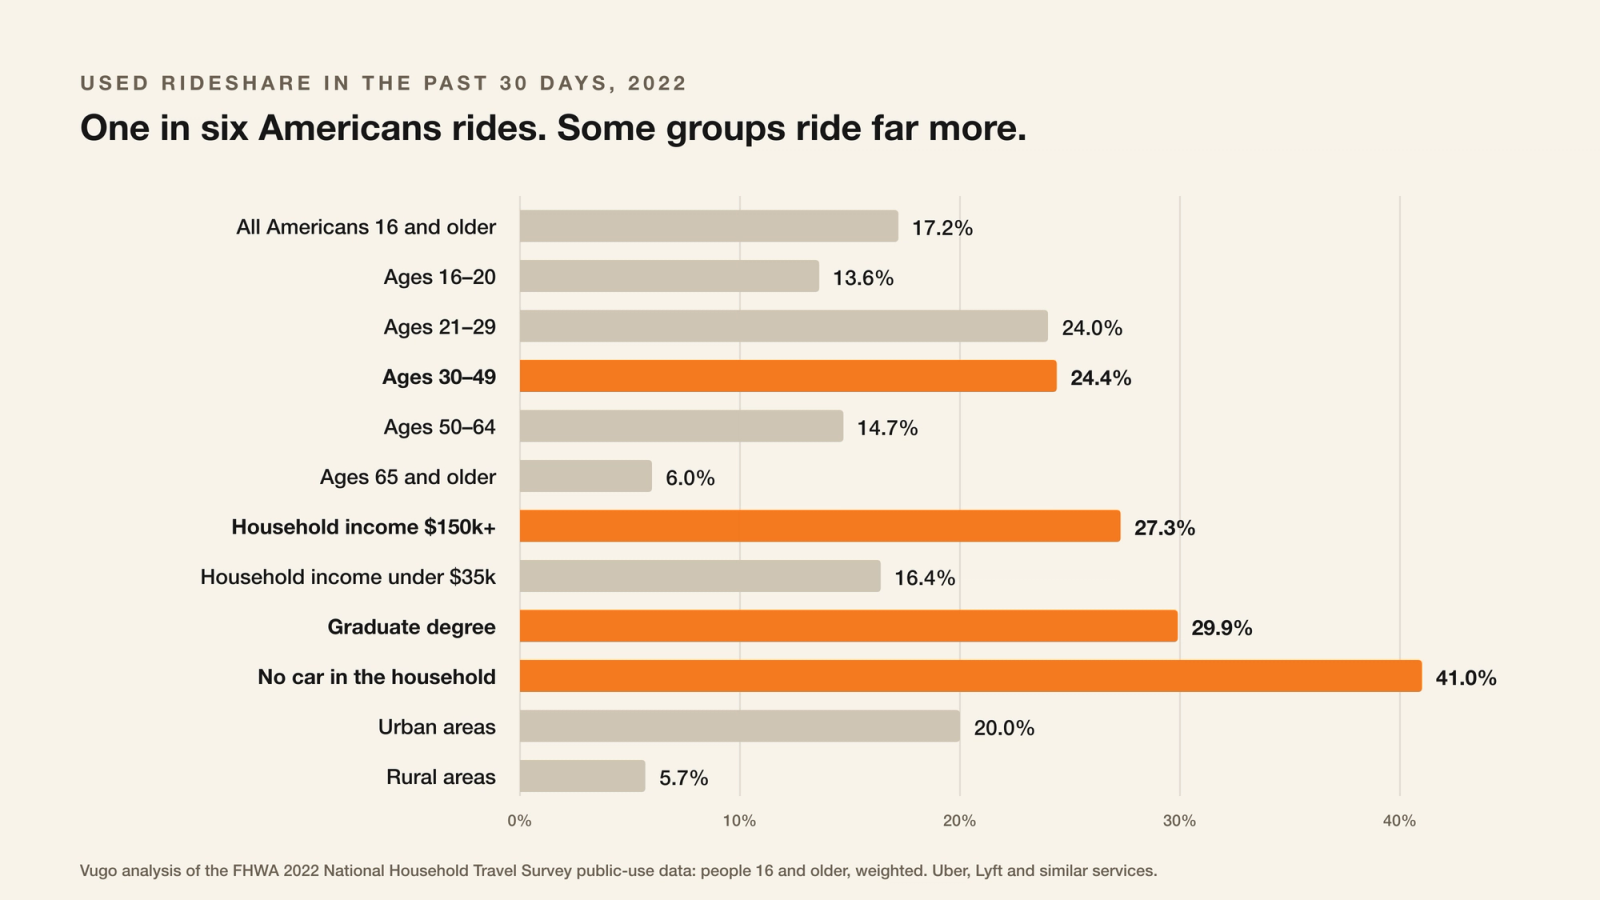
- One in six Americans rides. 17.2% of people 16 and older used rideshare in the past month: about 44.5 million people.
- Riders are adults. 94% of riders are 21 or older: about 41.8 million people.
- The core rider is 30 to 49. One in four people aged 30 to 49 rode in the past month, and that age group makes up nearly half of all riders.
- Riders are well-educated and well-paid. 29.9% of people with a graduate degree rode, and 27.3% of people in households earning $150,000 or more.
- People without a car ride most. 41% of people in car-free households rode in the past month.
- Riders live in cities. 94% of riders live in urban areas, and nearly half live in metros of 3 million people or more.
Age: the thirties and forties
Rideshare is often thought of as a young person's habit. The data says otherwise. There are two ways to look at it: how many people in each age group rode, and what share of all riders each age group makes up.
How many in each age group rode in the past month:
- Ages 16 to 20: 13.6%
- Ages 21 to 29: 24.0%
- Ages 30 to 49: 24.4%
- Ages 50 to 64: 14.7%
- 65 and older: 6.0%
Each age group's share of all riders (these add up to 100%):
- Ages 16 to 20: 6.0%
- Ages 21 to 29: 18.2%
- Ages 30 to 49: 47.4%
- Ages 50 to 64: 21.1%
- 65 and older: 7.3%
People aged 30 to 49 make up nearly half of all riders. Those are people in their peak earning and spending years: commuting, traveling for work, going out, and making the household's buying decisions.
Nearly every rider is 21 or older. Riders aged 21 and older make up 94.0% of all riders, about 41.8 million people, and they account for 94.2% of all the days anyone used rideshare. Among all adults 21 and older, 17.5% rode in the past month. For brands that can only market to adults 21 and older, rideshare riders are almost entirely that audience.
Income and education
Riders lean toward the top of the income range: 27.3% of people in households earning $150,000 or more rode in the past month, and those households account for 34.9% of all riders. Riding dips in the middle-income brackets and rises again among lower-income households: 16.4% of people in households earning under $35,000 rode.
Education follows the same pattern. 29.9% of people with a graduate degree rode, against about one in six Americans overall.
No car, no problem
The single strongest predictor of riding is not having a car. 41% of people in households with no vehicle used rideshare in the past month. For them, rideshare isn't an occasional treat. It's part of how they get around.
Cities and big metros
Rideshare is an urban habit: 20% of people in urban areas rode in the past month, against 5.7% in rural areas, and 94% of riders live in urban areas. In metros of 3 million people or more, 26.1% rode, and those big metros are home to nearly half of all riders.
How often, and where to
A smaller group takes most of the rides. In 2022, the most frequent half of riders accounted for about four in five of the days anyone used rideshare. A peer-reviewed study of the 2017 survey (Conway, Salon and King, Urban Science, 2018) found the same pattern: half of riders took 83% of rides.
Rides go to work and to going out. The 2017 survey's travel diaries give the clearest picture of where taxi and rideshare trips end:
- work, 18%;
- recreation such as parks, movies, bars and museums, 16.5%;
- restaurants, 9.9%;
- visiting friends, 9.3%;
- shopping, 9.2%;
- a change of mode, such as an airport or a station, 9.0%;
- health care, 6.8%.
About a quarter of those trips started between 7 p.m. and midnight, and a third were on weekends.
Taxis are still in the mix. 4.2% of Americans 16 and older used a taxi service in the past month in 2022, about 10.9 million people.
Read it right
- The 2022 survey is smaller than 2017's and used a new method, so the jump from 9.8% of people riding in 2017 to 17.2% in 2022 is real growth plus some change in how it was measured. The Federal Highway Administration says so itself.
- "Used rideshare" means at least once in the past 30 days, not how often.
- The survey covers people 16 and older, so the age shares are of riders 16 and up; younger passengers aren't counted.
- These are our tabulations of the survey's public data, weighted to the population. The published report confirms the headline figures; the breakdowns are Vugo's.
What it means for advertisers
The people in the back seat are the people many brands work hardest to reach: professionals in their thirties and forties, households with money to spend, city dwellers who go out, and travelers on their way to the airport.
Vugo's in-vehicle screens put a brand in front of them while the car is on the road, with a QR code within reach. Plan by market, and use TripIntent® to put your ad first when the car is near the kinds of places that matter to you.
Sources
Every figure here can be checked against the public data. We publish the script that rebuilds each one from the survey files, and its output: every figure, the survey variables and codes behind it, and how many people answered.
The survey. The Federal Highway Administration's National Household Travel Survey is public, free to download and in the public domain.
- 2022 survey, version 2 (data, codebook). Everything about who rides, how often and taxis comes from its person file. 14,730 people aged 16 and older answered whether they had used rideshare, Uber, Lyft or similar, in the past 30 days, and 2,294 said yes.
- 2017 survey (data, codebook). Where trips go, what time they start and the weekend share come from its trip file: 2,813 taxi and rideshare trips recorded in travel diaries. The 2022 diaries hold too few such trips to use.
- FHWA, Summary of Travel Trends: 2022 National Household Travel Survey, January 2024, Table 9-7 (PDF). It publishes the 17.2% headline. Our tabulation of the public file gives 17.25%, or 17.15% counting people who answered "don't know"; the breakdowns are ours.
How we counted. Every percentage is weighted with the survey's own person weight (trip weight for trips), so it stands for the U.S. population 16 and older. Answers like "don't know" or "prefer not to say" are left out of a group's figures, never counted as no. We used no replicate weights, so the figures carry no margins of error, and small groups (people 16 to 20: 86 riders) are less certain than large ones.
What each figure is built from (2022 person file unless noted):
- Rode in the past 30 days: LAST30_RDSHR, yes (01) against yes or no (01 or 02).
- Age: R_AGE. Riders 21 and older: 2,208 of the 2,294 riders; their share of rideshare days uses RIDESHARE22, the number of days each rider used rideshare.
- Income: household income, HHFAMINC. $150,000 or more is codes 10 and 11 (3,011 people, 792 riders); under $35,000 is codes 01 to 04 (2,443 people, 293 riders).
- Education: EDUC. Graduate degree is master's, professional or doctorate, codes 07 and 08 (3,013 people, 683 riders).
- No car: HHVEHCNT, the household's vehicles, equal to 0 (657 people, 257 riders).
- Cities and big metros: URBRUR, urban (01: 11,635 people, 2,141 riders) or rural (02: 3,095 people, 153 riders); metro size MSASIZE 05, 3 million or more (4,546 people, 1,117 riders).
- How often: RIDESHARE22 for the 2,257 riders who gave a number of days; the most frequent half is the top half of riders, by weight, ranked by days.
- Taxis: LAST30_TAXI, yes against yes or no (14,737 people, 544 users).
- 2017, rode in the past 30 days: the person file's RIDESHARE, more than 0, people 16 and older.
- 2017, where trips go: trips by taxi or limousine, including Uber and Lyft (TRPTRANS 17), by the purpose at the end of the trip that isn't home (WHYTO, or WHYFROM when the trip ends at home); start time STRTTIME; weekend TDWKND.
Other sources
- Conway, Salon and King, "Trends in Taxi Use and the Advent of Ridehailing, 1995–2017," Urban Science 2(3):79, 2018 (doi.org/10.3390/urbansci2030079). Peer-reviewed; the source of "half of riders took 83% of rides" in 2017.