
Most people never think about what a mile costs. They think about the fare, the car payment or the bus pass. But the cost of a mile is the number that decides who can afford to get around, and it is about to change more than it has in a century.
Here's what a mile costs today, where the money goes, and what the research says a mile could cost once the vehicle drives itself.
The short version
- Owning a car costs about 77 cents a mile. That's AAA's 2025 average for a new vehicle driven 15,000 miles a year: $11,577 a year in all.
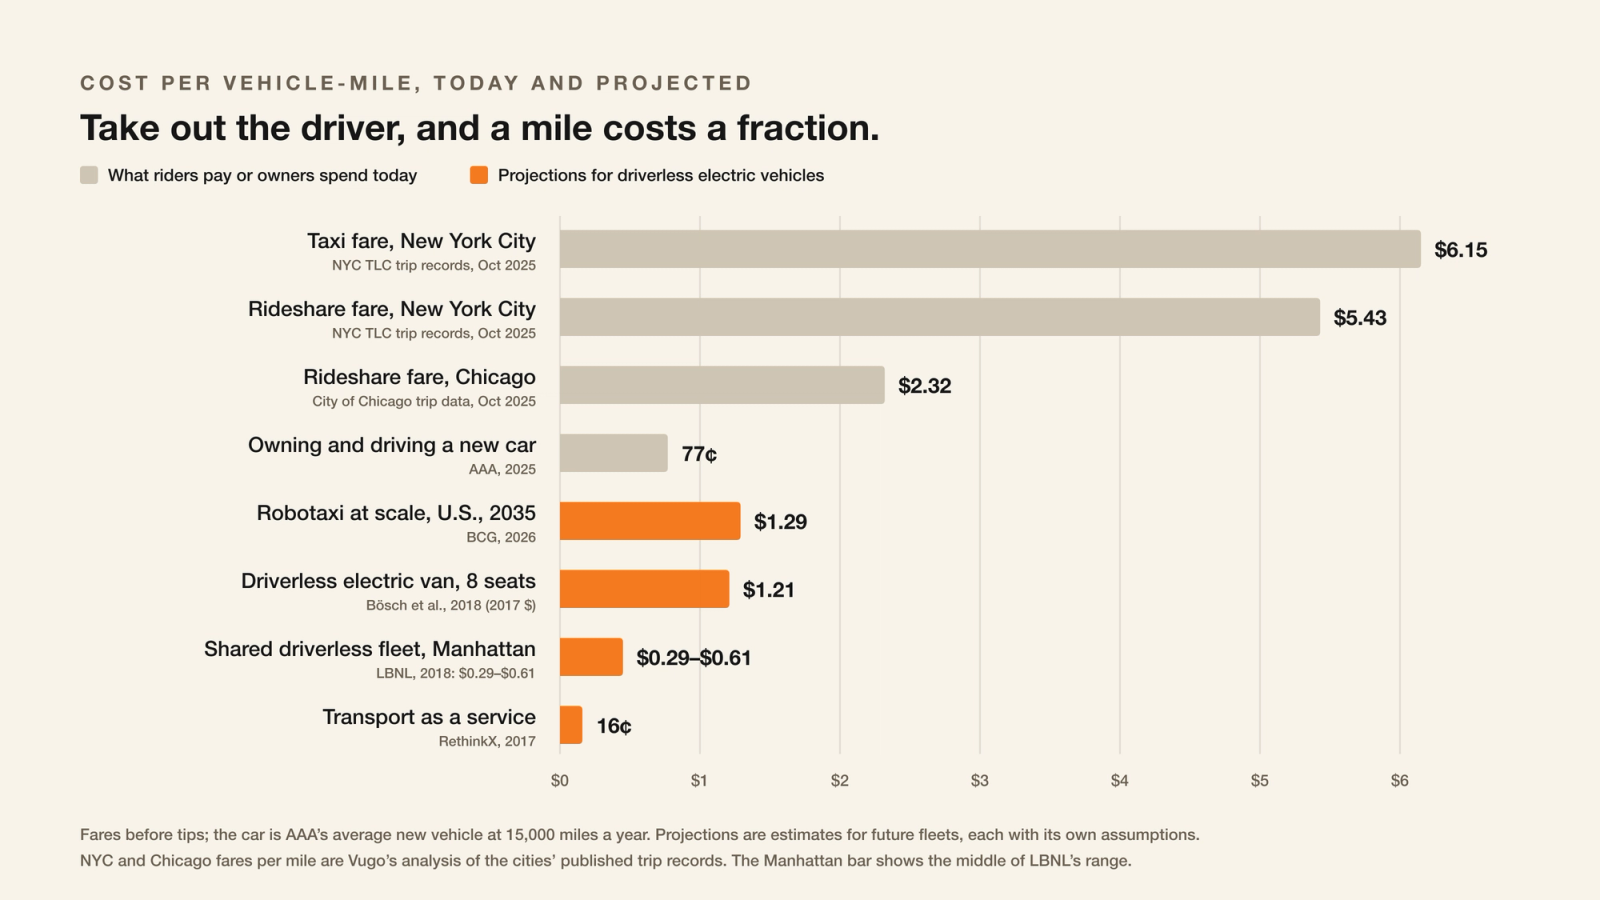
- A big-city rideshare costs a rider several dollars a mile. In New York, Uber riders paid about $5.43 a mile in base fare in October 2025, and about $6.60 with fees and taxes, before tips. In Chicago, the average was $2.32 a mile.
- Most of that pays for the driver. In New York, drivers' pay came to about 79% of the base fare.
- Take out the driver and the cost falls by most of the way. Peer-reviewed research puts a driverless urban taxi at about a sixth of today's cost per passenger. Projections for the next decade range from about $1.29 a mile down to 10 cents.
- Projections are projections. Some of the boldest have already missed their dates. The direction is clear; the timing isn't.
What a mile costs today
A car you own. AAA's Your Driving Costs study is the standard reference. Its 2025 edition puts the average new vehicle at about 77 cents a mile at 15,000 miles a year, and more if you drive less. Fuel, maintenance and tires are about a third of it. The rest is the car itself: depreciation, insurance, financing, registration. The IRS business mileage rate for 2026, 72.5 cents a mile, is in the same range.
A rideshare. New York and Chicago both publish every rideshare trip. In New York, Uber riders paid an average base fare of $5.43 a mile in October 2025, and $6.60 with fees and taxes, before tips. Lyft was close behind. In Chicago, the average fare came to $2.32 a mile, $3.33 with charges and tips. These figures are Vugo's analysis of each city's published trip records.
A taxi. New York's yellow-cab meter charges $3.00 to start and $3.50 a mile. With the charges for slow traffic and waiting, riders paid an average meter fare of $6.15 a mile in October 2025, before tips.
A bus. Across the U.S., a bus costs about $15.80 for each mile it runs in service, and about $2.42 per passenger-mile. The average trip costs $8.24 to run, and the rider's fare covers about 90 cents of it. Transit riders already pay a small part of what their ride costs. (Vugo arithmetic from the Federal Transit Administration's National Transit Database, 2024.)
Where the money goes
In a rideshare or a taxi, the biggest cost is the person driving. In New York, the share of the base fare paid to drivers came to about 79% in October 2025. The driver's own costs for the vehicle — the car, insurance, fuel and upkeep — were about 87 cents a mile in the city's latest study of driver expenses.
Researchers at UC Davis and the Institute for Transportation and Development Policy put the driver at "50% or more of ride-hailing costs" (Three Revolutions in Urban Transportation, 2017). So most of a big-city fare isn't the car. It's the driver's time. That's why taking the driver out of the vehicle changes the math more than anything else could.
What a mile could cost without a driver
Researchers have been modelling this for a decade, and their numbers vary widely. That's because their assumptions do.
- Today, at launch: Boston Consulting Group puts a robotaxi's cost at about $5 to $10 a kilometer in its first years in a city, about $8 to $16 a mile. New services are expensive while fleets are small.
- At scale, by 2035: BCG sees "a clear path" to about 80 cents a kilometer in the U.S., about $1.29 a mile, and about half that in China.
- The peer-reviewed benchmark: Bösch, Becker, Becker and Axhausen's cost model (Transport Policy, 2018) found an urban taxi's cost per passenger would "plummet" from 2.73 to 0.41 Swiss francs a kilometer once it drives itself. That's about $4.46 a passenger-mile down to 67 cents, in 2017 prices.
- A shared driverless fleet: Lawrence Berkeley National Laboratory modelled an electric, driverless fleet serving Manhattan at $0.29 to $0.61 per revenue mile, "an order of magnitude lower" than the city's taxis and rideshares today.
- Sharing is what makes it cheapest: the same UC Davis and ITDP study found that vehicles that are driverless, electric and shared together could cut the cost of urban vehicles, roads and transport services by over 40% by 2050, against business as usual: savings approaching $5 trillion a year worldwide. Driverless cars that stay privately owned save far less, because more expensive vehicles and extra driving eat up the gains.
- The optimistic end: RethinkX projected "transport as a service" at 16 cents a mile, falling to 10, and pooled rides at 5 cents a passenger-mile, falling to 3.
Read it right
These are projections, and some have already slipped. RethinkX expected its 16-cent mile by 2021, and UC Davis and ITDP assumed mass-market driverless cars from about 2025; neither happened on time. A 2016 McKinsey scenario had about 15% of new cars fully driverless by 2030.
Each one assumes something different:
- Bösch's model includes cleaning, which becomes almost a third of a driverless taxi's cost, but has no separate line for remote supervision.
- RethinkX assumes full approval for driverless vehicles, cars that last 500,000 miles and insurance 90% cheaper.
- ARK Invest's model counts remote operators. ARK also holds a large stake in Tesla.
Company statements are claims, not evidence. Waymo and Zoox don't publish a cost per mile.
The direction is what holds up across all of them. Take out the driver and run the vehicle on electricity, and the cost of a mile falls by most of the way. Share the vehicle, and it falls again.
Why it matters
Transportation is the second-largest bill an American household pays, behind only housing. In 2024, the average household had an income of $104,207 before taxes and spent $78,535. Housing took $26,266 of it. Transportation came next, at $13,318: cars, fuel, insurance, repairs, fares. That's 17.0% of all household spending, more than food, and more than twice the $6,197 spent on healthcare. (U.S. Bureau of Labor Statistics, Consumer Expenditure Survey, 2024.)
Imagine giving that budget back. Across the country's 136 million households, that's about $1.8 trillion a year (Vugo arithmetic from the same survey). Every dollar a family doesn't spend getting around is a dollar for rent, savings, school or the people they love. A mile that costs a fraction of today's changes who can get to work, to the doctor or to a night out. It also changes what it takes to make that mile free.
This doesn't push drivers out. Building fleets of driverless vehicles will take years, and for the foreseeable future people will keep driving, and earning from it. Drivers who own their cars could also put them to work on the same networks, so the vehicle keeps earning for them.
Free transportation has been Vugo's mission since its early days: The Case for Free Transportation, written in 2018, argued that advertising could pay for most short rides once vehicles drive themselves.
Today, Vugo's in-vehicle screens already earn money for drivers and fleets while their cars are on the road. As the cost of a mile falls, that kind of revenue covers more and more of it.
Every figure in one place. Vugo's research reference brings the costs, projections and sources together: What a mile costs, and what it takes to make it free.
Sources
Every figure above comes from the source named beside it, and every source is public. Where we did the arithmetic ourselves, it says so, and the method is here.
What a mile costs today
- AAA, Your Driving Costs, 2025 edition: 77 cents a mile and $11,577 a year for an average new vehicle at 15,000 miles a year; fuel 13 cents and maintenance, repair and tires about 11 cents of each mile (AAA Newsroom, September 2025; fact sheet, PDF).
- IRS business mileage rate: 72.5 cents a mile for 2026 (IRS news release IR-2025-128, December 29, 2025).
- New York rideshare: Vugo analysis of the city's high-volume for-hire trip records for October 2025 (NYC Open Data). Uber (licence HV0003): 15,470,172 trips over 79,162,961 miles. The base fare a mile is the sum of base_passenger_fare divided by the sum of trip_miles. "With fees and taxes" adds tolls, the Black Car Fund charge, sales tax, the congestion surcharge, the airport fee and the congestion-zone fee, and leaves out tips. Drivers' share is driver_pay divided by base_passenger_fare. Lyft (HV0005): $5.20 a mile in base fare.
- Chicago rideshare: Vugo analysis of the city's transportation network provider trips for October 2025, 8,157,065 trips with a recorded distance (Chicago Data Portal): fare divided by trip miles, then with additional charges and tips.
- New York taxi: the meter rates are the city's (NYC Taxi and Limousine Commission, taxi fare: $3.00 to start, 70 cents a fifth of a mile). The $6.15 is Vugo analysis of the yellow-cab trip records for October 2025, 4,134,696 trips (NYC Open Data): meter fare divided by trip distance, before tips.
- Drivers' vehicle costs in New York: about 87 cents a mile, the TLC's weighted expense factor (TLC driver expense report, PDF).
- Bus: Vugo arithmetic from the Federal Transit Administration's National Transit Database, annual data, report year 2024, all reporters, motor bus (data.transportation.gov). Total operating expenses divided by vehicle revenue miles ($15.80), by passenger-miles ($2.42) and by unlinked passenger trips ($8.24); fare revenue divided by trips (90 cents).
What a mile could cost without a driver
- UC Davis and ITDP, Three Revolutions in Urban Transportation, Fulton, Mason and Meroux, 2017 (PDF, archived copy): drivers "50% or more of ride-hailing costs" (p. 7); costs cut "by over 40%", savings "approaching $5 trillion per year" (p. 2).
- Boston Consulting Group, "Here at Last: The Evolution of the Robotaxi," January 2026 (bcg.com): $5 to $10 a kilometer at launch, 80 cents a kilometer in the U.S. at scale by 2035. Converted at 1.609 kilometers a mile.
- Bösch, Becker, Becker and Axhausen, "Cost-based analysis of autonomous mobility services," Transport Policy 64 (2018), 76–91 (doi.org/10.1016/j.tranpol.2017.09.005; free version at ETH Zurich): 2.73 to 0.41 Swiss francs a kilometer. Converted at 1.609 kilometers a mile and about $1.02 a franc, 2017's average exchange rate.
- Bauer, Greenblatt and Gerke (Lawrence Berkeley National Laboratory), "Cost, Energy, and Environmental Impact of Automated Electric Taxi Fleets in Manhattan," Environmental Science & Technology, 2018 (doi.org/10.1021/acs.est.7b04732; PubMed abstract): $0.29 to $0.61 per revenue mile.
- RethinkX, Rethinking Transportation 2020–2030, Arbib and Seba, May 2017 (publisher's page; PDF, archived copy): 16 cents falling to 10, and pooled rides 5 cents falling to 3 (Box 2, p. 17).
Read it right
- McKinsey, Automotive revolution: perspective towards 2030, January 2016 (PDF): "up to 15 percent of new cars sold in 2030 could be fully autonomous" (p. 11).
- ARK Invest, autonomous taxi model (ark-invest.com), checked November 4, 2026. Tesla is among the holdings of ARK's flagship fund (checked November 4, 2026: ARK Innovation ETF holdings).
Why it matters
- U.S. Bureau of Labor Statistics, Consumer Expenditures 2024, December 19, 2025 (news release): average household (consumer unit) income before taxes $104,207, spending $78,535, housing $26,266, transportation $13,318, food $10,169, healthcare $6,197. The national figure is Vugo arithmetic: the survey's 135,760,000 households times $13,318, about $1.81 trillion.